Heart Disease Prediction and Analysis
December 5, 2024
Introduction
The Heart Failure Prediction Dataset contains 918 patient records with 11 clinical features and one binary label: HeartDisease. The goal is to use these features to predict susceptibility to heart failure.
Feature Overview
Features:
- Age: Age in years
- Sex: M (Male), F (Female)
- ChestPainType: TA, ATA, NAP, ASY
- RestingBP: Resting blood pressure (mm Hg)
- Cholesterol: Serum cholesterol (mg/dl)
- FastingBS: 1 if FastingBS > 120 mg/dl, else 0
- RestingECG: Normal, ST, LVH
- MaxHR: Max heart rate achieved (60–202)
- ExerciseAngina: Y (Yes), N (No)
- Oldpeak: Depression
- ST_Slope: Up, Flat, Down
Label:
- HeartDisease: 1 = heart disease, 0 = normal
Descriptive Statistics
Categorical and Binary Variables
| Variable | Type | Proportion |
|---|---|---|
| Sex | Binary | M = 79%, F = 21% |
| FastingBS | Binary | 0 = 77%, 1 = 23% |
| ExerciseAngina | Binary | Y = 40%, N = 60% |
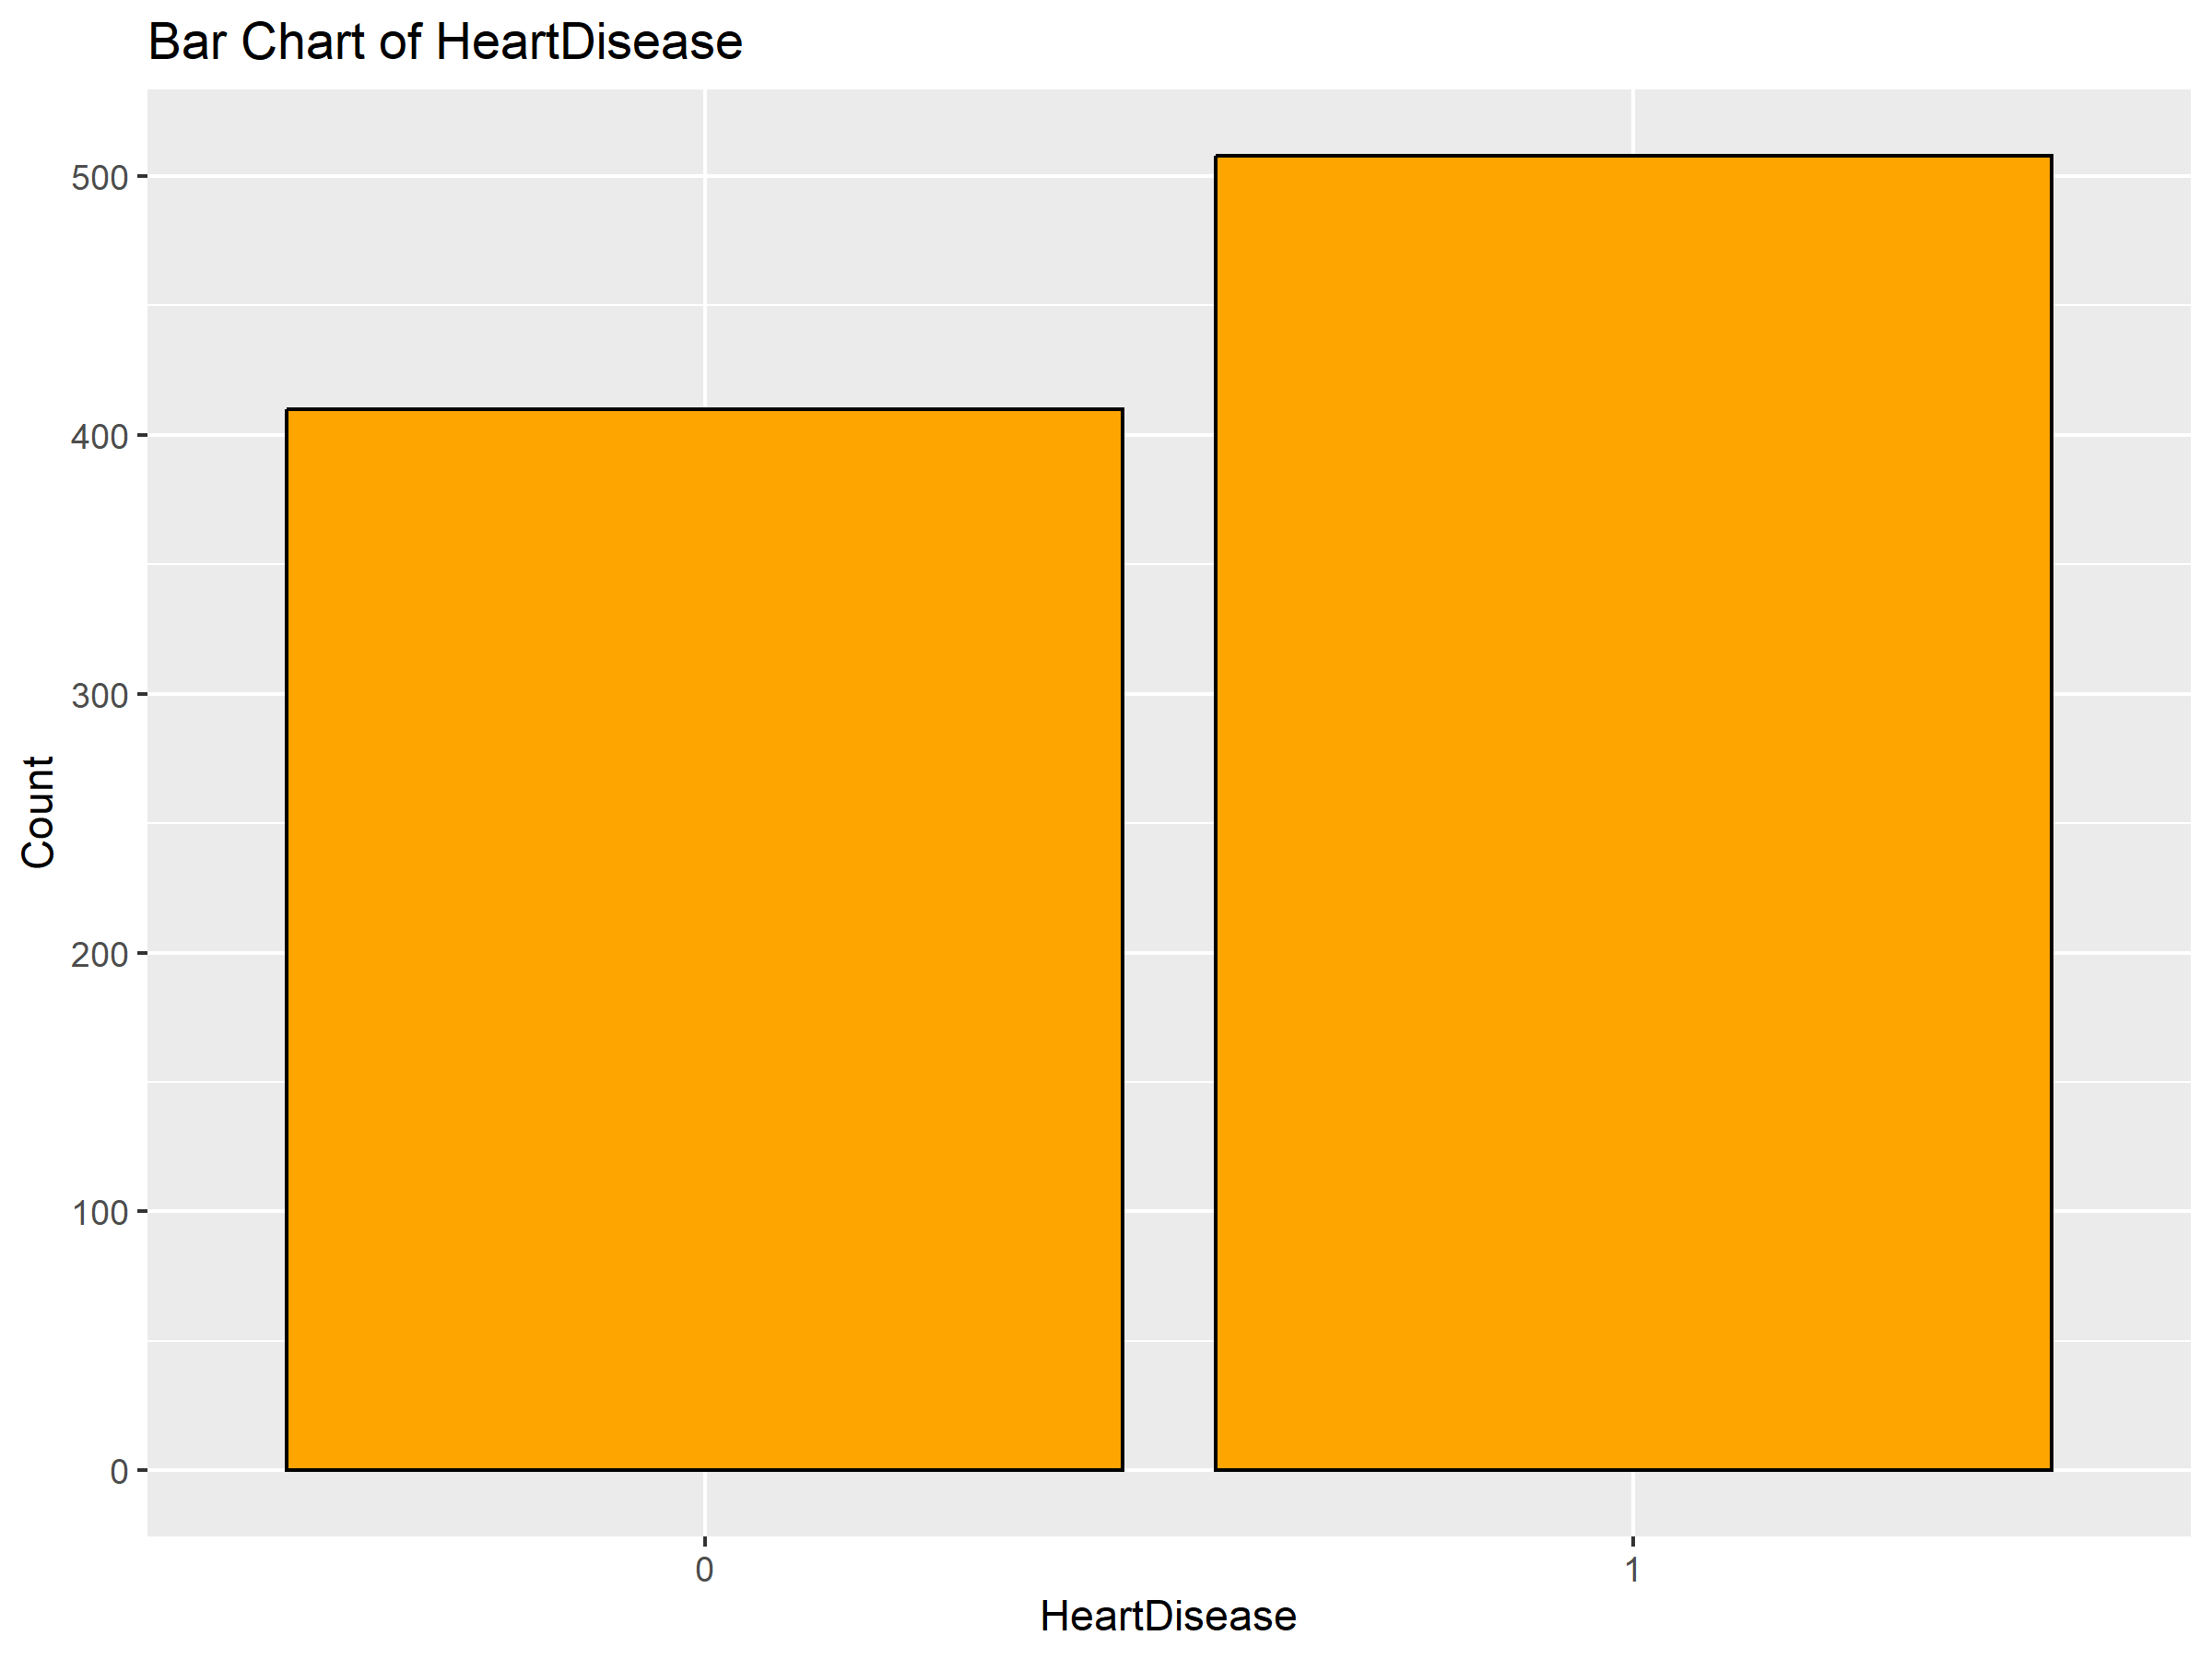
| HeartDisease | Binary | 0 = 45%, 1 = 55% |
| ChestPainType | Categorical | ASY = 54%, ATA = 19%, NAP = 22%, TA = 5% |
| RestingECG | Categorical | LVH = 20%, Normal = 60%, ST = 20% |
| ST_Slope | Categorical | Down = 7%, Flat = 50%, Up = 43% |
Numeric Variables
| Variable | Type | Mean | Median | SD | Min | Max | Q1 | Q3 | IQR |
|---|---|---|---|---|---|---|---|---|---|
| Age | Integer | 53.51 | 54 | 9.43 | 28 | 77 | 47 | 60 | 13 |
| RestingBP | Integer | 132.4 | 130 | 18.51 | 0 | 200 | 120 | 140 | 20 |
| Cholesterol | Integer | 198.8 | 223 | 109.4 | 0 | 603 | 173.25 | 267 | 93.75 |
| MaxHR | Integer | 136.81 | 138 | 25.46 | 60 | 202 | 120 | 156 | 36 |
| Oldpeak | Continuous | 0.89 | 0.6 | 1.07 | -2.6 | 6.2 | 0 | 1.5 | 1.5 |
Data Cleaning
KNN Imputation
Cholesterol had no missing values but contained invalid zeros. We used KNN imputation to replace these, retaining a binary column MissingCholesterolNum to indicate where zeros originally appeared.
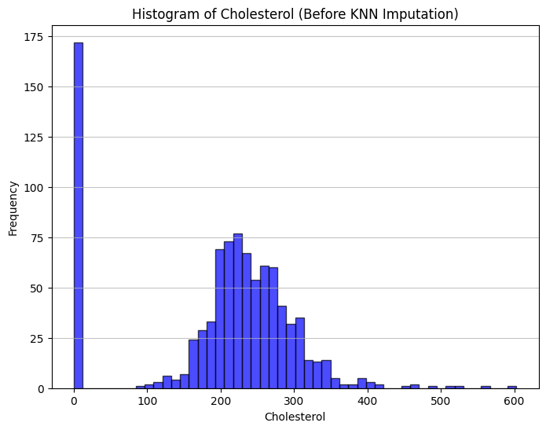
Figure: Cholesterol distribution before KNN imputation
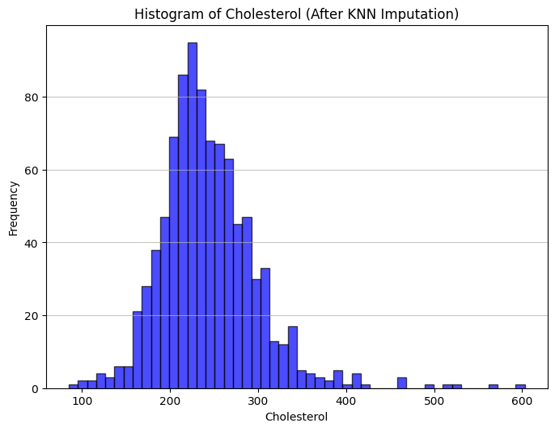
Figure: Cholesterol distribution after KNN imputation
Categorical Encoding
- One-hot encoding for
RestingECGandExerciseAngina - Ordinal encoding for
ST_Slope - Removed one dummy per encoded group to prevent multicollinearity
Hypothesis Testing
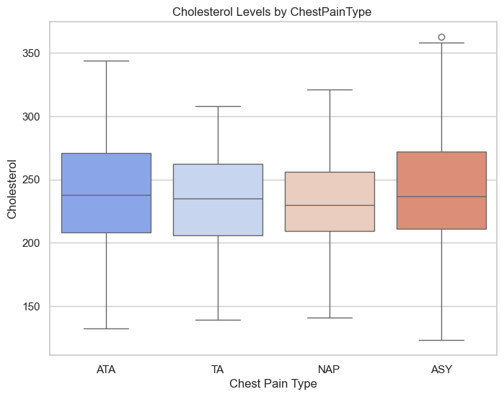
ANOVA on Cholesterol
ANOVA across ChestPainType:
- F = 1.95
- p = 0.119
→ No significant difference in cholesterol means across pain types.
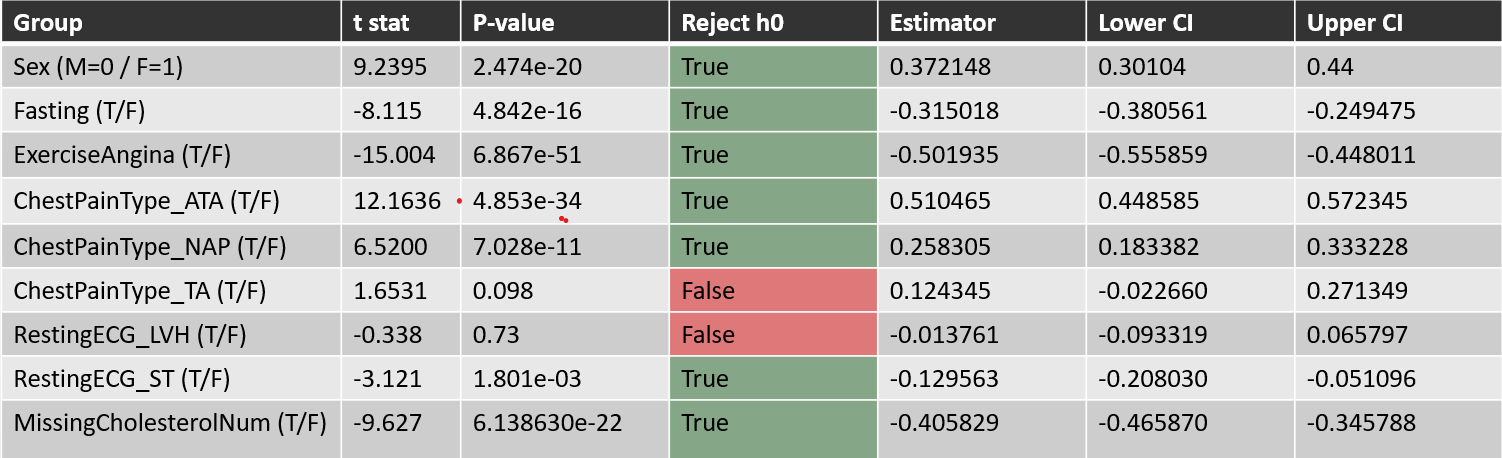
Pairwise Proportion Tests
Tested binary features vs heart disease prevalence using:
Estimator: p̂₀ - p̂₁ H₀: p̂₀ = p̂₁ H₁: p̂₀ ≠ p̂₁
Model Development
We trained logistic regression using:
Models Trained
- Entire Features Model
- Pruned Features Model
- Pruned Features + Outliers Removed
Assumptions Checked
- ✅ Independence of observations
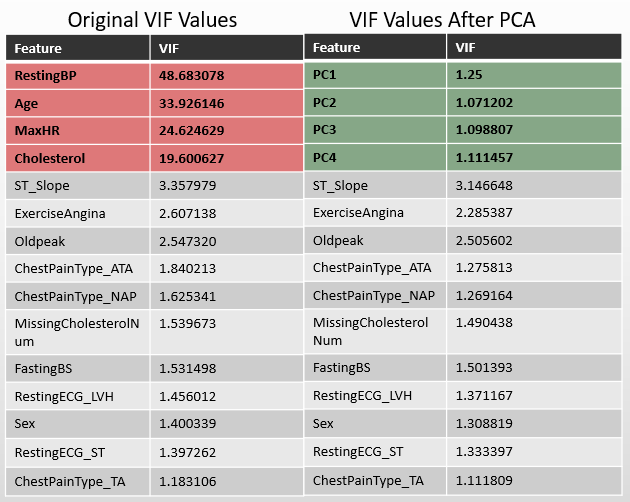
- ✅ Linearity in logit
- ✅ No multicollinearity (handled with PCA on correlated features)
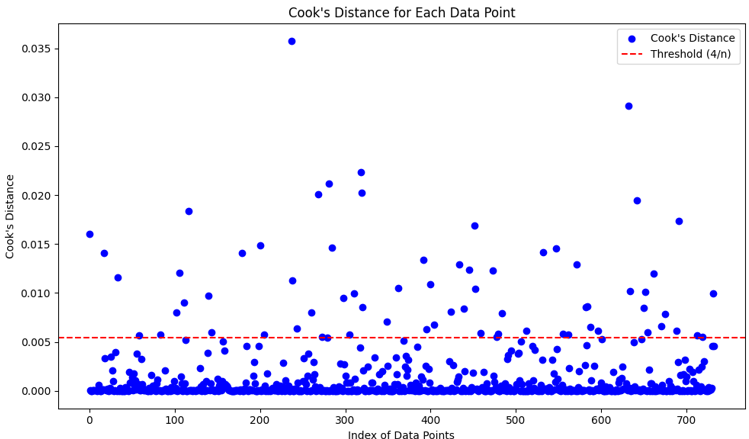
- ✅ Outliers removed using Cook's distance > 4/n
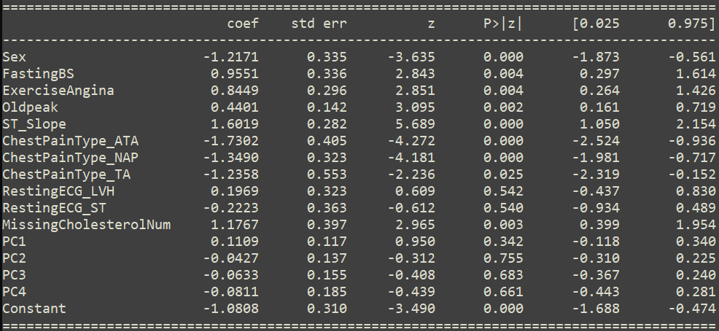
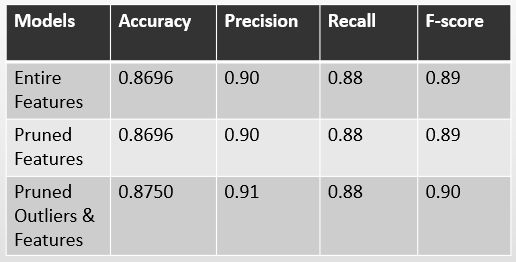
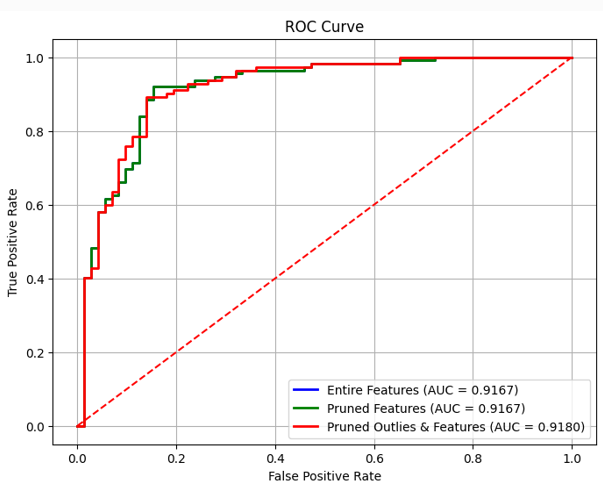
Model Results
- All models performed well
- Pruned + Outlier model had best balance of precision/recall
- Most significant features:
- Sex, FastingBS, ExerciseAngina, Oldpeak
- ST_Slope, ChestPainType_ATA, ChestPainType_TA
- MissingCholesterolNum, Constant
Conclusion
This project demonstrated a strong pipeline for heart disease prediction via logistic regression. Key takeaways:
- KNN imputation handled missing/zero values
- Statistical testing helped evaluate relationships
- Feature selection + outlier removal improved model performance
- Logistic regression is a strong baseline with interpretable results
Visualizations
Continuous Features
MaxHR, Oldpeak, Age, RestingBP, Cholesterol
(See histograms and boxplots)
Categorical Features
ChestPainType, ExerciseAngina, FastingBS, ST_Slope, RestingECG, Sex
Label